I decided to go after between a mix of two prompts: Indirect portrait using physical objects and data. To begin with, I went around browsing for a little bit looking for data about average caffeine consumption. Then I decided to narrow it down to only coffee and tea because I wanted to focus on experimenting more than trying to do 5 categories.
I then created an Instagram poll asking for the number of cups of coffee and tea people would drink in a day. Although not everyone on my Instagram is in college, the vast majority is in the group.
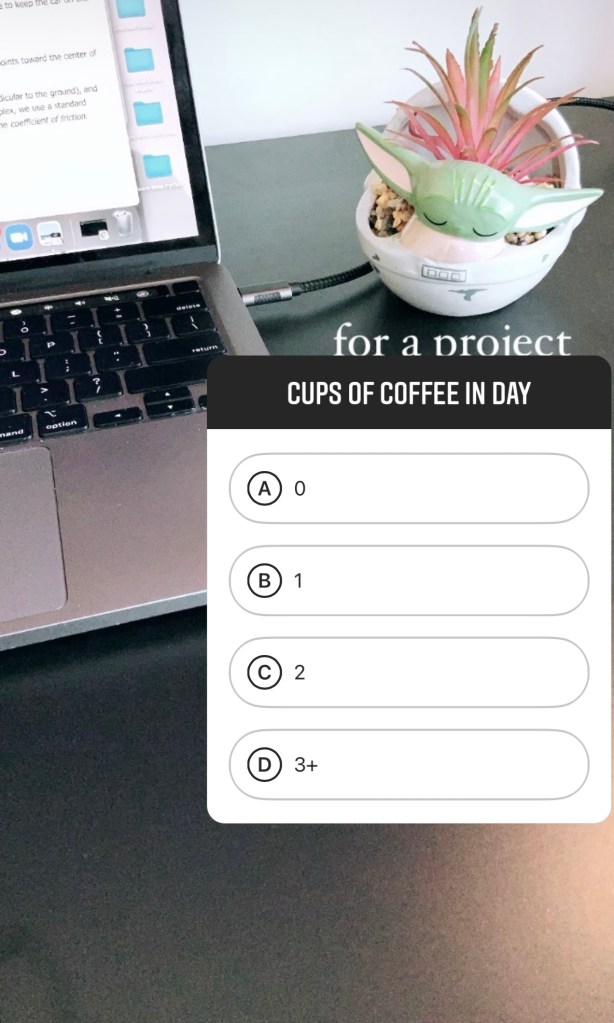
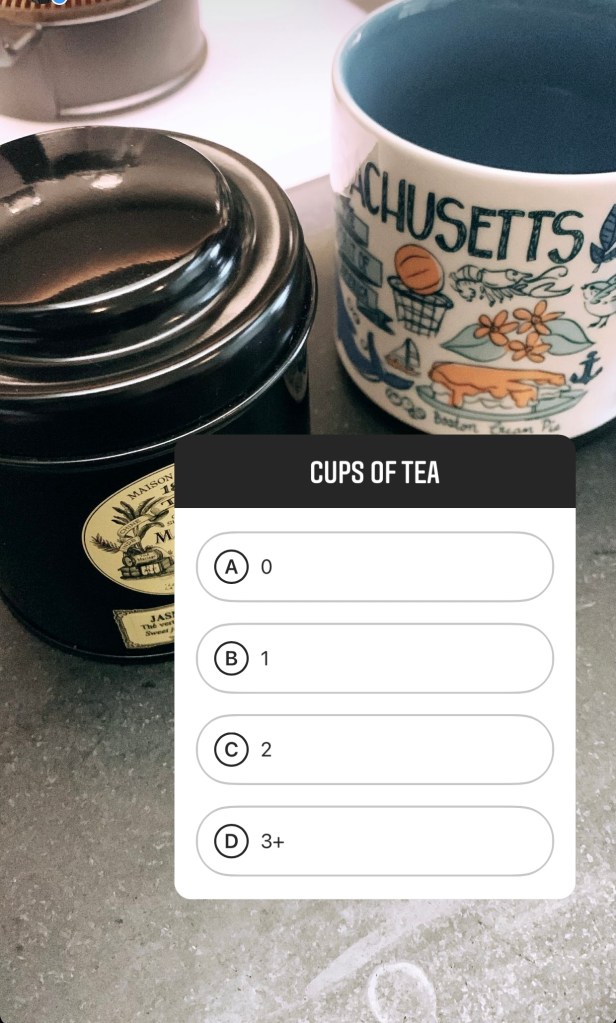
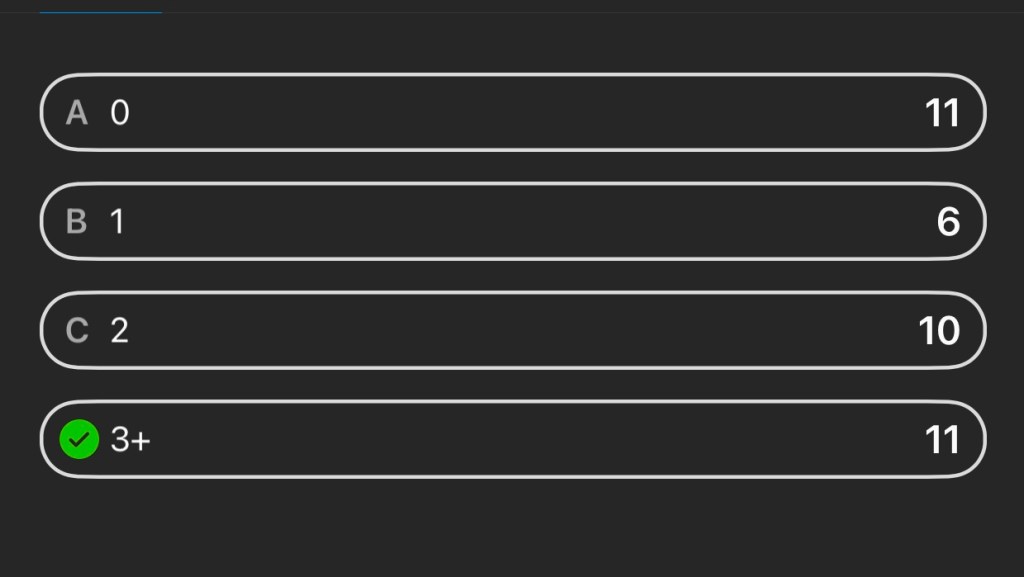
At 1:36 pm I then took the results from the poll with coffee consumption on the left and tea consumption on the right.
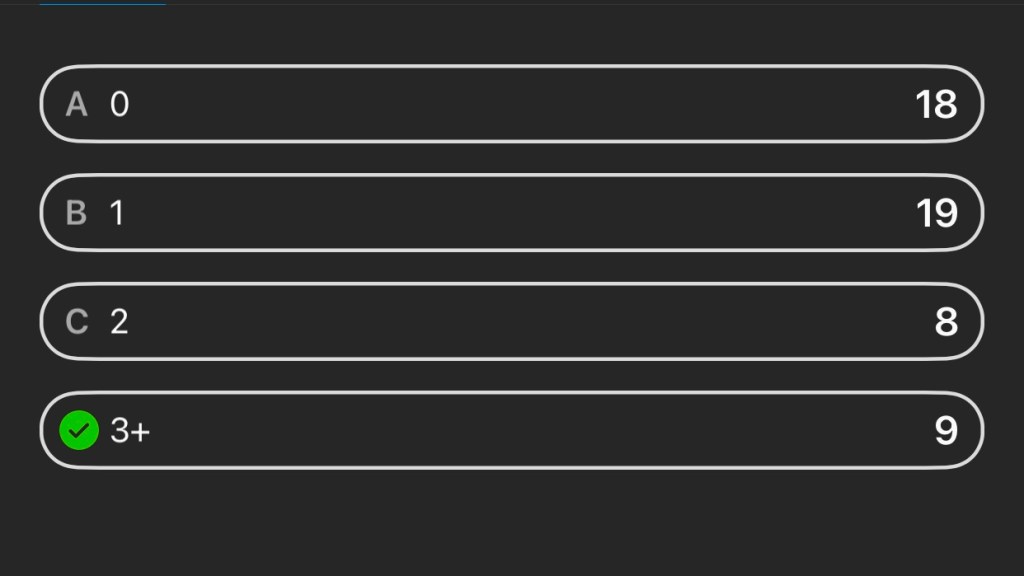
Coffee: When we look at the average coffee consumption online, it says that the average person consumes about 1.5 cups of coffee a day. Of the results we have about 33% of people having no cups, 35% having 1 cup, 14% having two cups, and around 17% having 3 or more cups in a day.
Tea: On the other hand when we look online for the average tea consumption online, it is somewhere around 2 cups a week from respondents. However in our poll numbers drastically differ with 29% having no cups, 16% having 1 cup, 26% having two cups, and another 29% having 3 or more cups in a day.
Using this kind of data I decided to play around downstairs with some coffee grounds and tea bags to see what I could do.
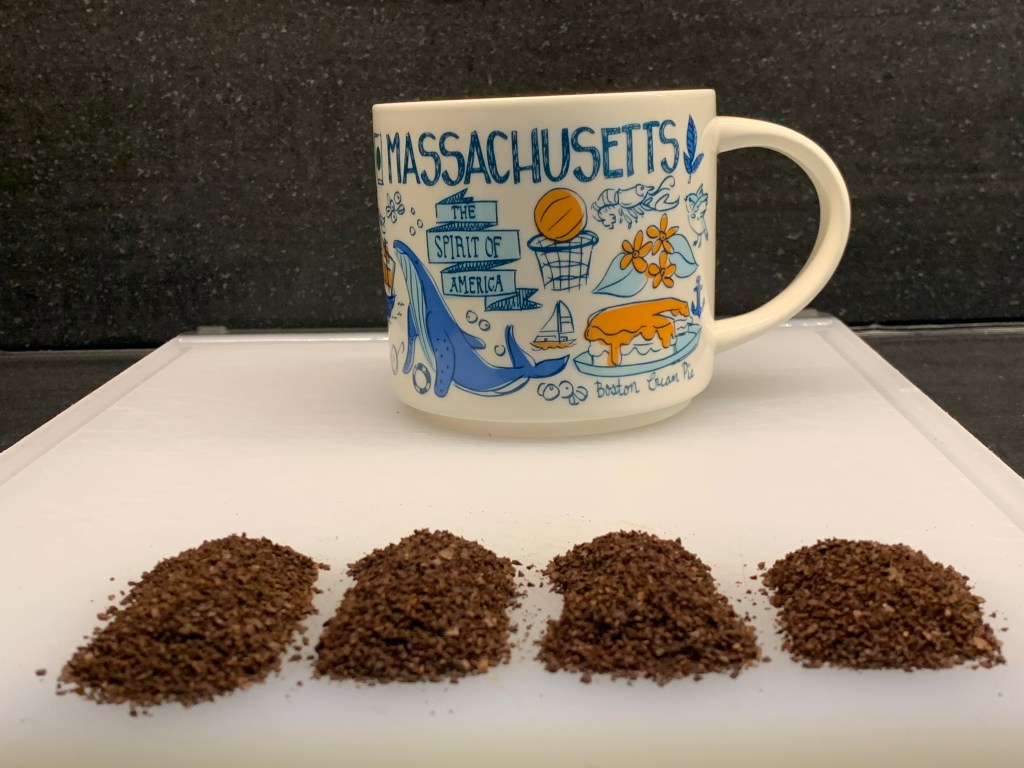
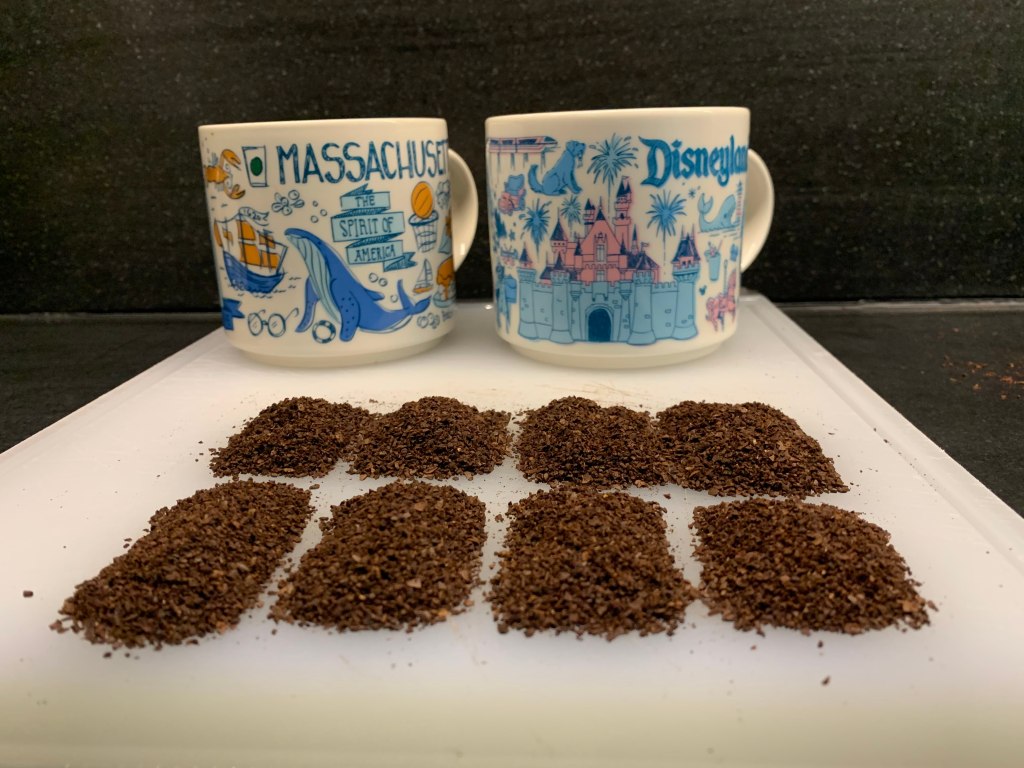
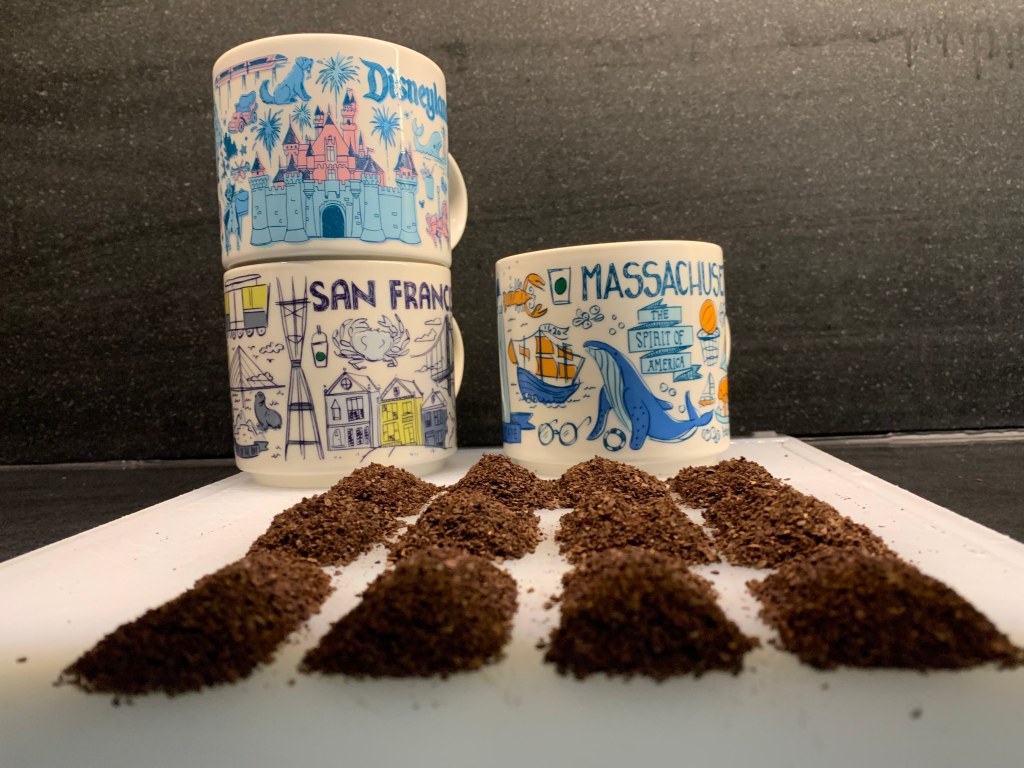
Each row of coffee grounds was one cup of coffee.
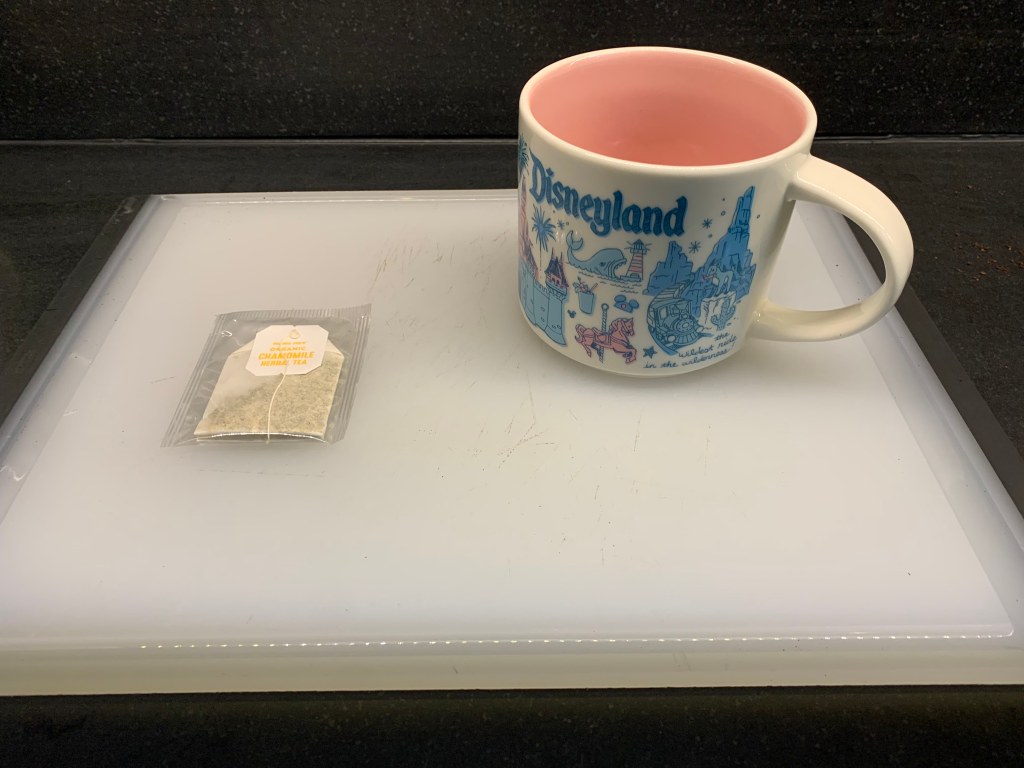
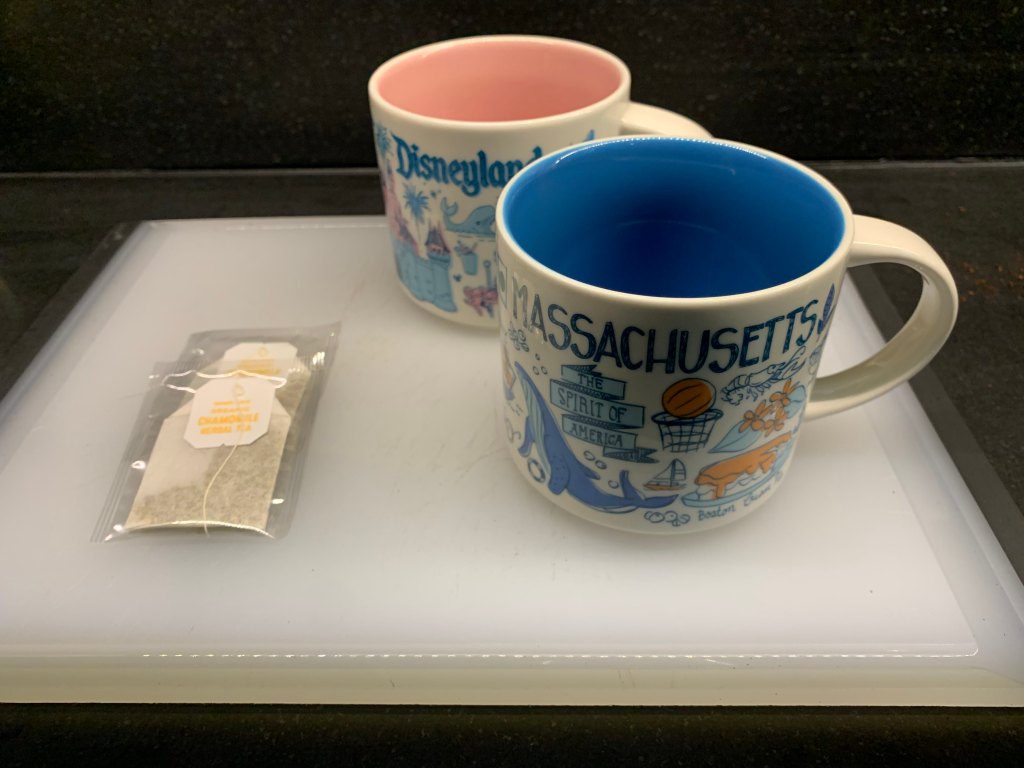
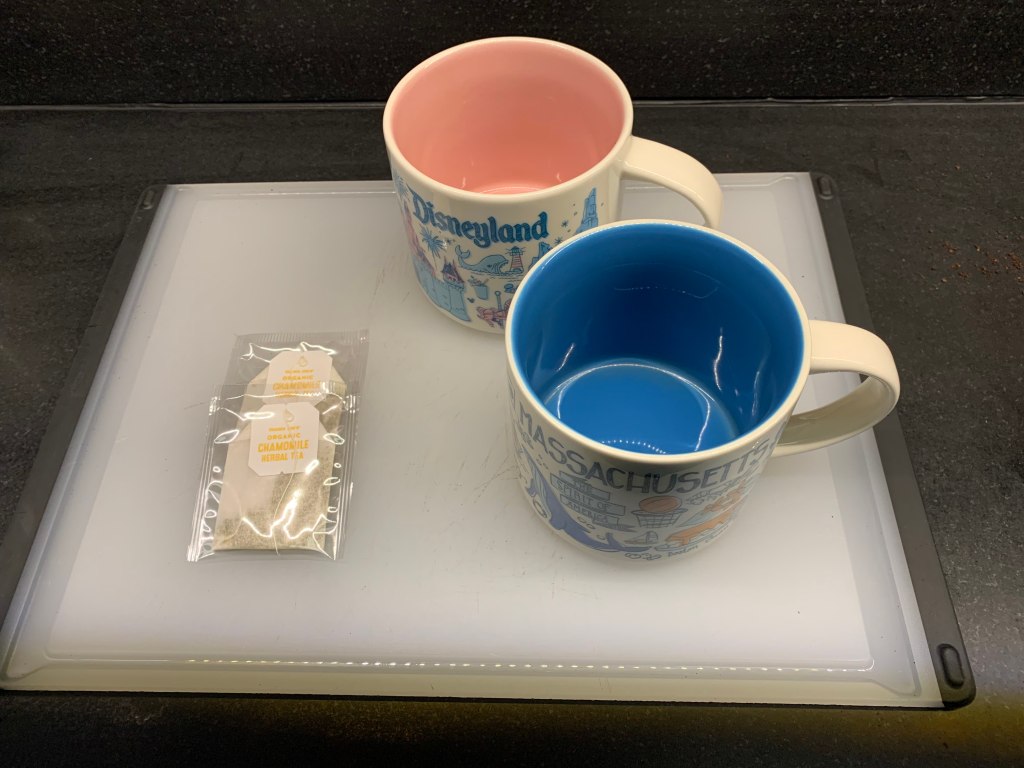
Similar but more straightforward version of the concept with tea bags.
The biggest thing I struggled with was how would I physically compare the poll data to that of one serving of tea/coffee. I thought of creating a distribution of grounds, then realized that I had a black counter and table. I’m a little stuck on figuring out how to compare it. Maybe I could use the number of bugs with labels on the x-axis.

Leave a comment